Tactical Asset Allocation using Fed Sentiment Data
- In this article, we construct a leading indicator for shifts in the business cycle using Fed speech sentiment data.
- Using this data, we present a tactical asset allocation strategy: overweight bonds when the Fed is dovish and underweight when hawkish.
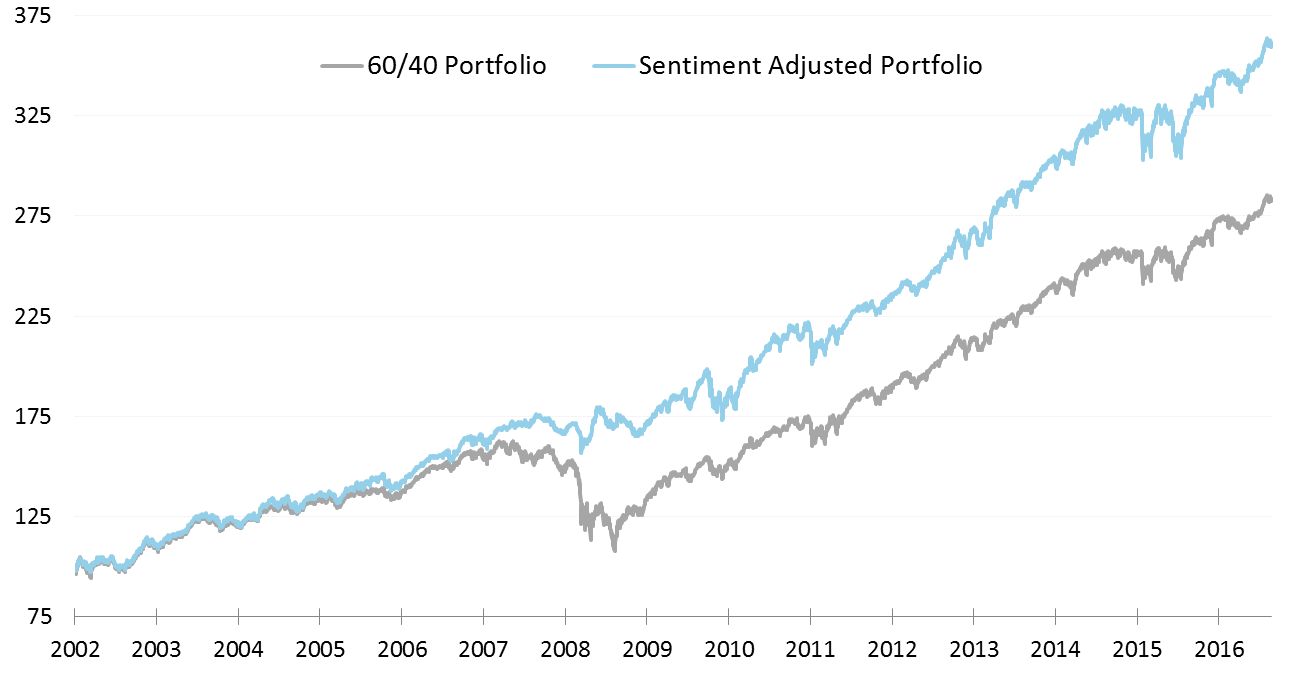
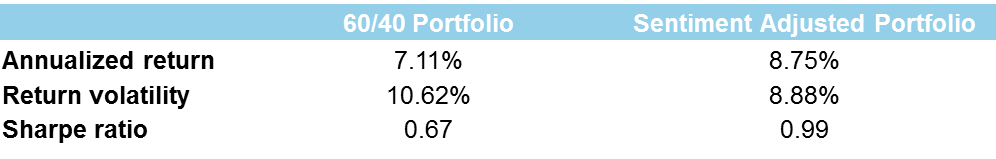
- Over the past 15 years, this strategy outperformed a 60/40 benchmark portfolio by 1.5% annually while reducing volatility by 2%.
- With the Fed currently leaning hawkish, our strategy suggests a modest overweight to US equities relative to treasuries.
At Hawkai, we spend a lot of time thinking about the Fed’s communication problem. The fundamental issue is not the communications themselves, but the fact that the majority of investors have to process this information in a qualitative way. It is difficult to filter the signal from the noise if you are manually reading central bank speeches or newswire headlines. Sure, the Fed has sounded relatively hawkish lately, but exactly how hawkish have they sounded and what difference does it make for markets?
The allocation to SPY is calculated as follows:
where 0% <= A <= 100%.
In this experiment, we allow for rebalancing on a daily basis, though this could be adjusted to a monthly or quarterly frequency by expanding the averaging window when constructing the sentiment index. The long-run average equity allocation in our dynamic portfolio matches the benchmark at 60%. Using Fed sentiment to tactically allocate between equities and bonds resulted in a roughly 1.5% increase in average annual returns while simultaneously reducing volatility by almost 2%. Below I report “lazy” Sharpe ratios with a 0 risk-free return.
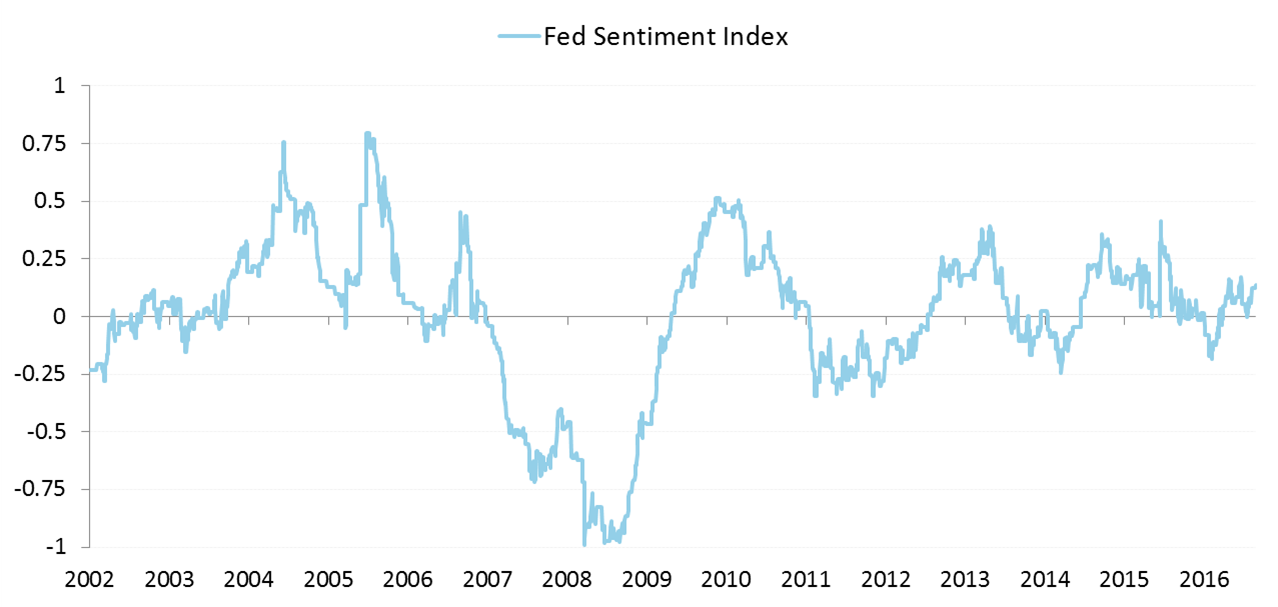
It’s clear that easier monetary policy is good for bond prices, whether it is traditional rate cuts or QE, but what about our allocation to stocks? Macroeconomics tells us that policy loosening should be good for risky assets as risk-premia are lowered. However there is an important difference between easier policy and the Fed sounding more dovish. In fact, what the Fed’s communication patterns show is that shifts in sentiment occur before policy is actually loosened. In early 2007, the Fed started to shift more dovish before beginning their multi-year easing cycle in September of that year. Again in 2011, sentiment trends started to shift dovish at the beginning of the year before the US debt-ceiling and European debt crisis rattled markets that summer.
Monetary policy affects the real economy with a multi-year lag. It takes time for lower rates to feed into increased borrowing and spending. Markets will generally react favorably to an initial easing announcement, but the impact on demand occurs over time. In practice, when the Fed is turning dovish, it’s because the economic outlook is negative, and the expected returns on risky assets are lower than average.
The Fed Sentiment Index leans slightly hawkish around +0.15, suggesting a modest overweight to equities, or a 70% allocation in our model. Central bank sentiment data can be a valuable tool to overlay systematic views within a more sophisticated asset allocation framework.