Trading the FOMC Statement: What Moves Markets?
- As Fed communications have evolved, the actual policy rate has become an afterthought compared to the tone of the statement and changes in economic forecasts.
- Among the materials released by the Fed, we find that the sentiment of the policy statement and revisions to the dot-plot are the most important predictors of the market reaction, while inflation and unemployment forecasts carry little value.
- Using these results, we present an indicator which demonstrates statistically significant explanatory power for market reactions to FOMC policy announcements.
FOMC events have become increasingly complex
Traditionally, the market reaction to FOMC policy decisions was driven by the policy surprise: the actual rate versus the market-implied rate. For a number of reasons, that strategy no longer works. First, the policy rate has remained unchanged at almost every meeting since the financial crisis. Instead, market participants had to evaluate the impact of nonstandard policy measures for which there is no observable pricing. Even within the current tightening cycle, futures markets are incredibly efficient at predicting the policy rate, such that large surprises are increasingly rare (the current Fed deliberately avoids surprising the market).
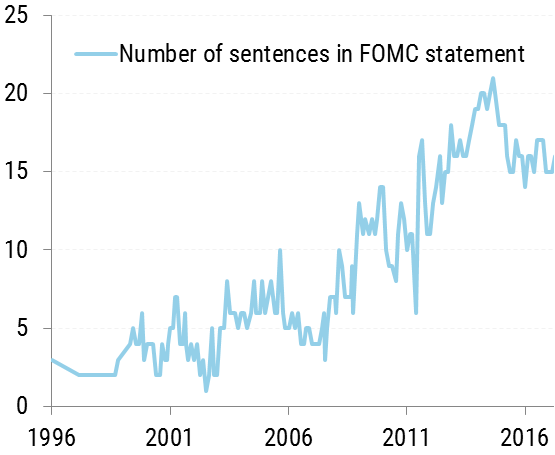
At the same time, the Fed underwent a welcome shift toward greater transparency in the post-Greenspan era. The quarterly press conference was started by Bernanke in 2011, and the “dot-plot” was introduced in 2012 alongside the quarterly economic projections. The modern FOMC statement is now four times as long as it was at its inception.
Evaluating the market impact of policy communications
Ultimately, we need a new framework to predict the market impact of FOMC policy announcements. Qualitatively we know that markets move in response to hawkish or dovish statements or surprise revisions in the economic forecasts and dot-plots. In this experiment we measure the quantitative impact of each of these components on the 24-hour change in the US dollar vs. the Euro. We focus on the modern communication period starting in 2012 (42 events, 19 with economic projections). During this time, the release of these materials ranged from 12:30ET to 2:15ET. For pricing data we use the ECB fix, which is observed daily around 8:15am ET. To make the results more intuitive, we use the USD/EUR exchange rate (apologies to FX traders for not respecting the market convention).
We regressed percent changes in USD/EUR vs. five inputs: the statement sentiment, dot-plot, GDP, unemployment, and core PCE. For the forecast data, we use the average absolute changes vs. the previous forecasts. The sentiment data is Hawkai’s measure of the tone of a policy statement, which is expressed as a z-score. To quantify central bank texts we use a neural network which is trained on a dataset of historical samples classified by human experts. No market data is used in the training of the sentiment model.
First, the regression results:
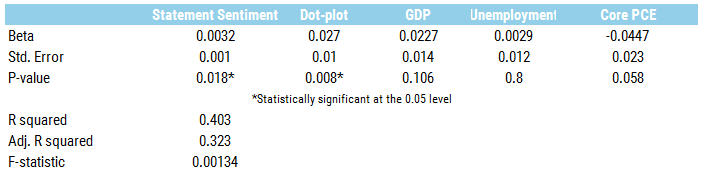
■ Statement Sentiment (statistically significant), 32bp market reaction per unit
It’s intuitively obvious that the FOMC statement moves the market. Using our sentiment dataset, we can now quantify this impact. Because the dataset is not fit to any market data, this experiment can be extended to other macro markets such as equity indices and fixed income.
It’s intuitively obvious that the FOMC statement moves the market. Using our sentiment dataset, we can now quantify this impact. Because the dataset is not fit to any market data, this experiment can be extended to other macro markets such as equity indices and fixed income.
■ Dot-plot (statistically significant), 27bp market reaction for a 10bp change in the projected policy path
We found a strong correlation between changes to the Fed’s forecast for the policy rate and the market reaction. Interestingly, the effect is present even though we did not adjust for market expectations. This suggests that, on average, market participants expect the dot plot to remain unchanged at any given meeting.
We found a strong correlation between changes to the Fed’s forecast for the policy rate and the market reaction. Interestingly, the effect is present even though we did not adjust for market expectations. This suggests that, on average, market participants expect the dot plot to remain unchanged at any given meeting.
■ GDP (weakly predictive), 22bp market reaction for each 0.1% change in the forecast for real GDP
GDP forecasts are somewhat useful in this case, which warrants further exploration in their predictive power over other asset classes.
GDP forecasts are somewhat useful in this case, which warrants further exploration in their predictive power over other asset classes.
■ Unemployment (not predictive)
Given the Fed’s dual-mandate of maximum employment and price stability, you could be forgiven for thinking their unemployment forecasts would impact the market. In 2012, the Fed used explicit guidance of keeping policy accommodative while the unemployment rate was above 6.5%. However as the unemployment rate fell in the following years, it was abandoned in favor of other measures of labor market slack.
Given the Fed’s dual-mandate of maximum employment and price stability, you could be forgiven for thinking their unemployment forecasts would impact the market. In 2012, the Fed used explicit guidance of keeping policy accommodative while the unemployment rate was above 6.5%. However as the unemployment rate fell in the following years, it was abandoned in favor of other measures of labor market slack.
■ Core PCE (problematic)
This has a reasonable p-value but the beta is highly suspicious. The regression results imply that an upward revision in inflation forecasts should lead to USD weakening, the opposite of what common sense would dictate. One possible explanation is that the Fed targets inflation through expectations rather than realized inflation. As a result, they are disincentivized from moving their forecasts away from their inflation target lest they adversely affect expectations.
This has a reasonable p-value but the beta is highly suspicious. The regression results imply that an upward revision in inflation forecasts should lead to USD weakening, the opposite of what common sense would dictate. One possible explanation is that the Fed targets inflation through expectations rather than realized inflation. As a result, they are disincentivized from moving their forecasts away from their inflation target lest they adversely affect expectations.
Deriving a single Hawk-Dove score
Given the results above, we derived a single indicator for the market reaction to FOMC events. To do this, we normalized the dot-plot revisions so that the units were comparable to our statement sentiment scores. For meetings without economic projections, the combined score is simply the statement sentiment. For meetings with economic projections, we found that market volatility is about 50% higher, and the normalized dot-plot has twice the market impact of the statement sentiment. The combined score is thus defined as:
0.5 * Sentiment Score + Normalized Dot-Plot Revision
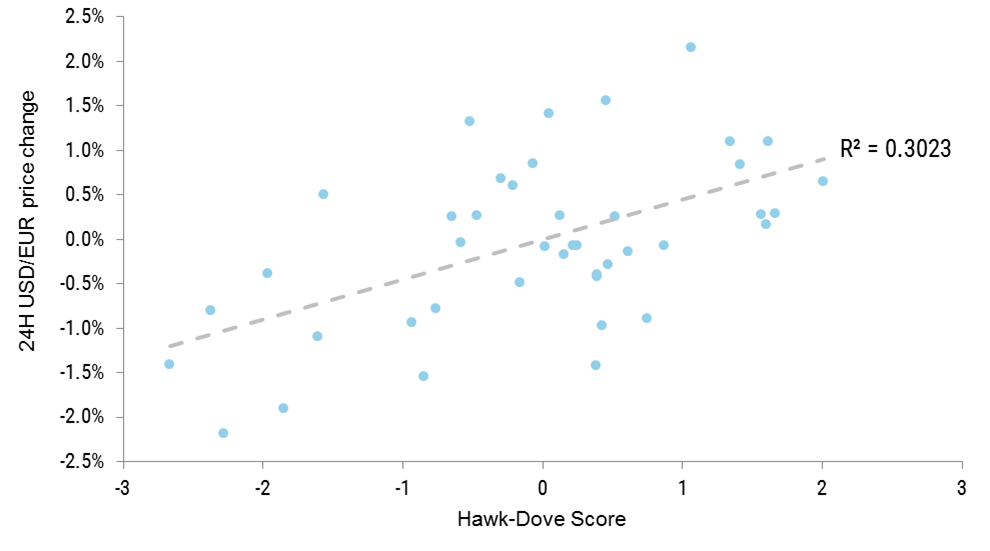 The result is a compelling linear relationship between the Hawk-Dove score and the corresponding market impact. Going forward, there are a number of areas of further research which we plan to cover in future posts. Since this indicator is essentially a z-score, it would be useful to evaluate the market reaction relative to implied daily volatility. Another alternative is repeating the experiment using intraday price data to further isolate the impact of the event. Finally, this research can be extended to other asset classes or a broader USD index.